Nicolai Haugsted

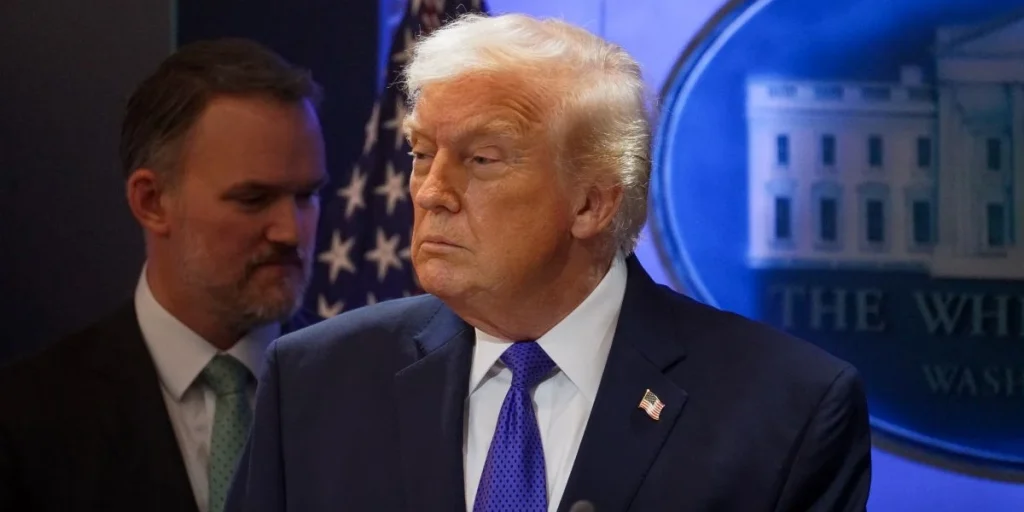
Trump’s midterm prospects face fresh scrutiny as election analyst points to historical warning signs.


American voters are approaching another consequential election, and the political atmosphere in Washington is growing increasingly tense.
With control of Congress at stake on November 3, both parties are examining opinion polls, voter turnout and economic conditions for clues about the country’s political direction.
For Republicans, the challenge involves defending their congressional majorities while President Donald Trump’s popularity remains under pressure. Political statistician Nate Silver has now offered a detailed explanation of why his election forecasting model is painting a difficult picture for the president’s party.
Appearing on CNN’s Fareed Zakaria GPS on Sunday, Silver identified three factors that he believes are particularly important: Trump’s approval rating, the national congressional polling average and the price Americans pay at the gas pump.


And according to the figures discussed during the interview, his model currently assigns Democrats a substantial statistical advantage in both chambers of Congress.
Nate Silver’s model delivers striking numbers
CNN host Fareed Zakaria began by drawing attention to the probabilities produced by Silver’s forecasting system, FLIPR, which is published through his Silver Bulletin platform.
“Your model at this point says the Democrats have about a 75, 76 percent chance of winning the Senate, and a 95 percent chance of winning the House,” Zakaria said.
The figures represent the model’s estimated probabilities, rather than actual election results or guarantees about what voters will do.
Newsweek has also reported that Silver’s Senate forecast was upgraded from “Lean D” to “Likely D,” reflecting a shift in the model’s assessment.
Silver explained that the numbers are based on several underlying political and economic indicators rather than a single opinion poll.
His analysis includes the president’s approval rating, historical midterm voting patterns and signs of increased Democratic participation.
Trump’s approval rating becomes a major factor
Silver highlighted the president’s standing with voters as one of the central elements of his assessment.
“You have a president with a 37 percent approval rating,” he said.
Such a figure, if reflected accurately in the electorate, presents a challenge for a governing party preparing for congressional elections.
Silver also pointed to the historical tendency for the president’s party to lose ground during midterms.
“You have a long history of the president’s party doing poorly in midterms, including in 2018 when under President Trump the GOP lost 41 seats in the House,” he explained.
The 2018 election saw Democrats regain control of the House during Trump’s first presidency.
However, historical patterns are only part of a forecasting model and cannot establish what will happen in a particular election.
Silver suggested that the current political environment also includes signs of heightened participation among Democratic voters.
“You’ve seen high turnout in Democratic primaries all year. We can talk about the early voting data, too,” he said.
CNN host questions whether the polls can be trusted
Zakaria raised a concern that has become familiar during recent American elections.
Polling organizations underestimated Trump’s support in the presidential contests of 2016, 2020 and 2024, leading to questions about whether similar errors could occur again.
“What makes everyone worried is in ’16, ’20, and ’24 polls underestimated Trump’s support,” Zakaria said.
He also raised the possibility of an “almost inherent problem in the way polling is done,” including voters who might be reluctant to reveal their preferences.
Silver rejected the assumption that polling errors involving Trump necessarily apply to Republican candidates in congressional races.
“I don’t think it’s fair to assume there will be shy Ken Paxton voters or shy Roger Marshall voters,” he said.
“Republicans did not beat their polling in 2018 or 2022. The midterm polling was quite unbiased.”
His distinction was that presidential elections featuring Trump and congressional midterms involve different candidates and voting conditions.
Past polling errors, therefore, do not automatically indicate that the current forecasts are systematically underestimating Republican support.
Gas stations become part of the political equation
While polling averages and approval ratings occupy much of the attention of political analysts, Silver believes another everyday expense deserves particular scrutiny.
Petrol prices.
During the CNN interview, he pointed to gasoline costing approximately $4.30 per gallon as an important element of the economic environment.
“If you take a step back and think about ‘what are the background conditions in this election,’ you have gas at four dollars 30 cents a gallon,” Silver said.
Fuel prices are particularly visible to consumers because they are displayed prominently along roads and can affect household budgets directly.
Silver argued that further increases before Election Day could influence public perceptions of the economy and the governing party.
“So what if you had another tick up in prices before election day?” he asked.
“That would, you know—any time you see a gas station it’s an advertisement for the Democrats, basically.”
The comment illustrated his argument that economic dissatisfaction can become a political liability even without a coordinated advertising campaign.
Gasoline prices, of course, fluctuate for numerous reasons, including global oil markets, supply disruptions and geopolitical events.
Their political significance depends partly on whether voters associate those changes with decisions made by the administration.
Historical comparisons add another dimension
Zakaria also highlighted analysis from CNN’s Harry Enten concerning Trump’s approval rating ahead of the midterms.
According to the figures discussed on the program, the president’s standing compares unfavorably with several previous administrations at similar stages.
“It’s the lowest approval rating for any president before midterm election,” Zakaria said.
“Worse than Harry Truman in ’46, worse than Bush in ’06. And in both cases, of course, that party lost both the House and the Senate.”
The comparison referred to the 1946 and 2006 congressional elections, when the governing parties suffered significant setbacks.
However, comparisons across different decades come with limitations, including changes in polling methodology, party coalitions and the broader political environment.
Silver’s model incorporates historical relationships, but its estimates remain sensitive to new information.